The Admin Dashboard is the first page you see after logging in as an administrator. It provides an at-a-glance view of your VoIP environment’s health, active calls, and key metrics—helping you spot issues or unusual activity the moment you log in. This centralized overview keeps critical information front and center, so you can monitor and manage your entire voice infrastructure efficiently from a single screen.
By clicking on the word "Administration" on the top menu bar, you'll be taken to your Admin Dashboard. You will see a graph and information about each calling system you have enabled.
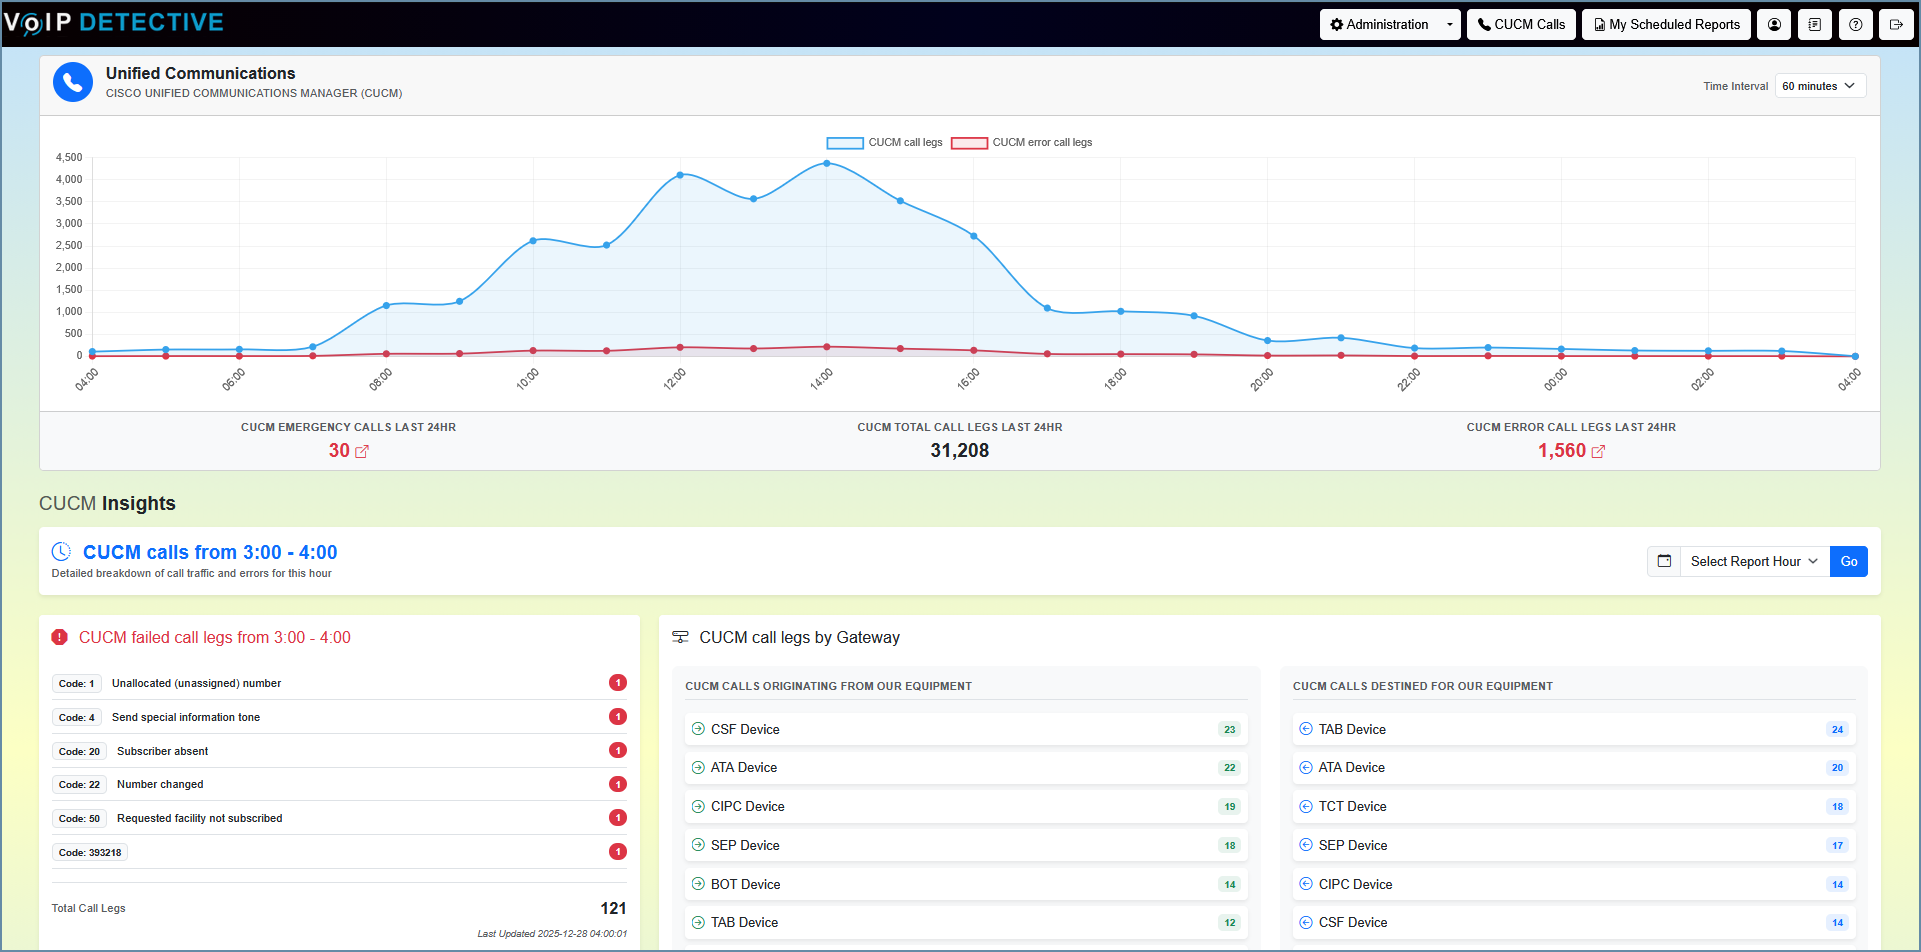
CUCM (CallManager) Dashboard
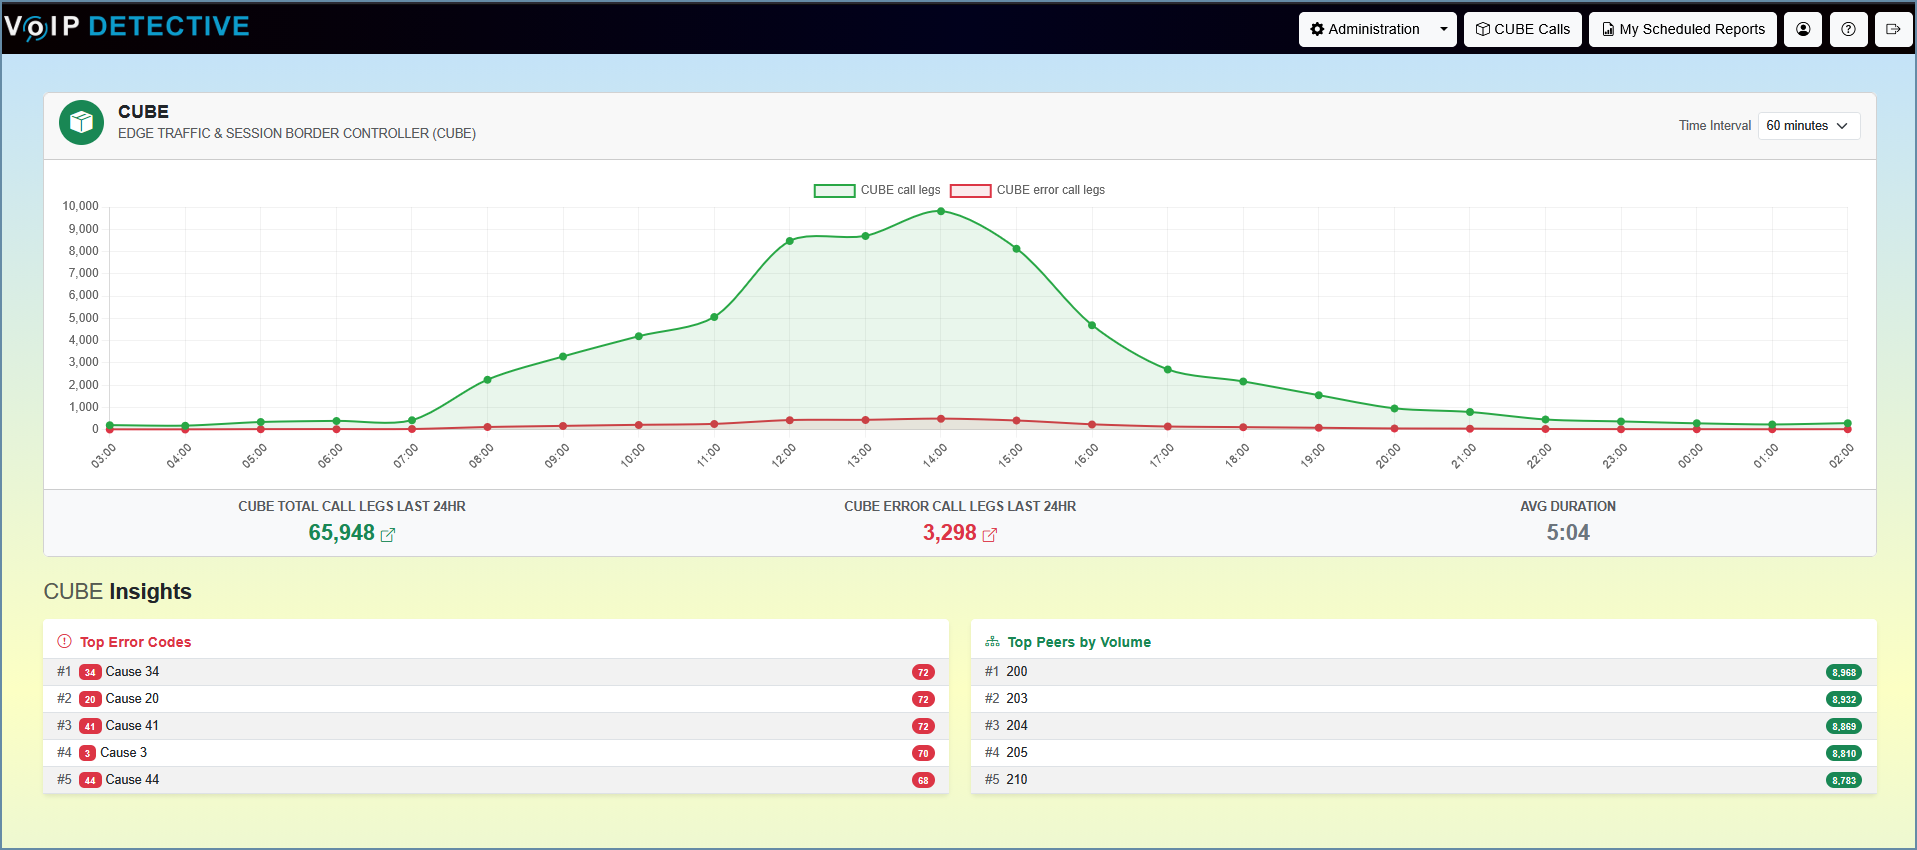
CUBE Dashboard
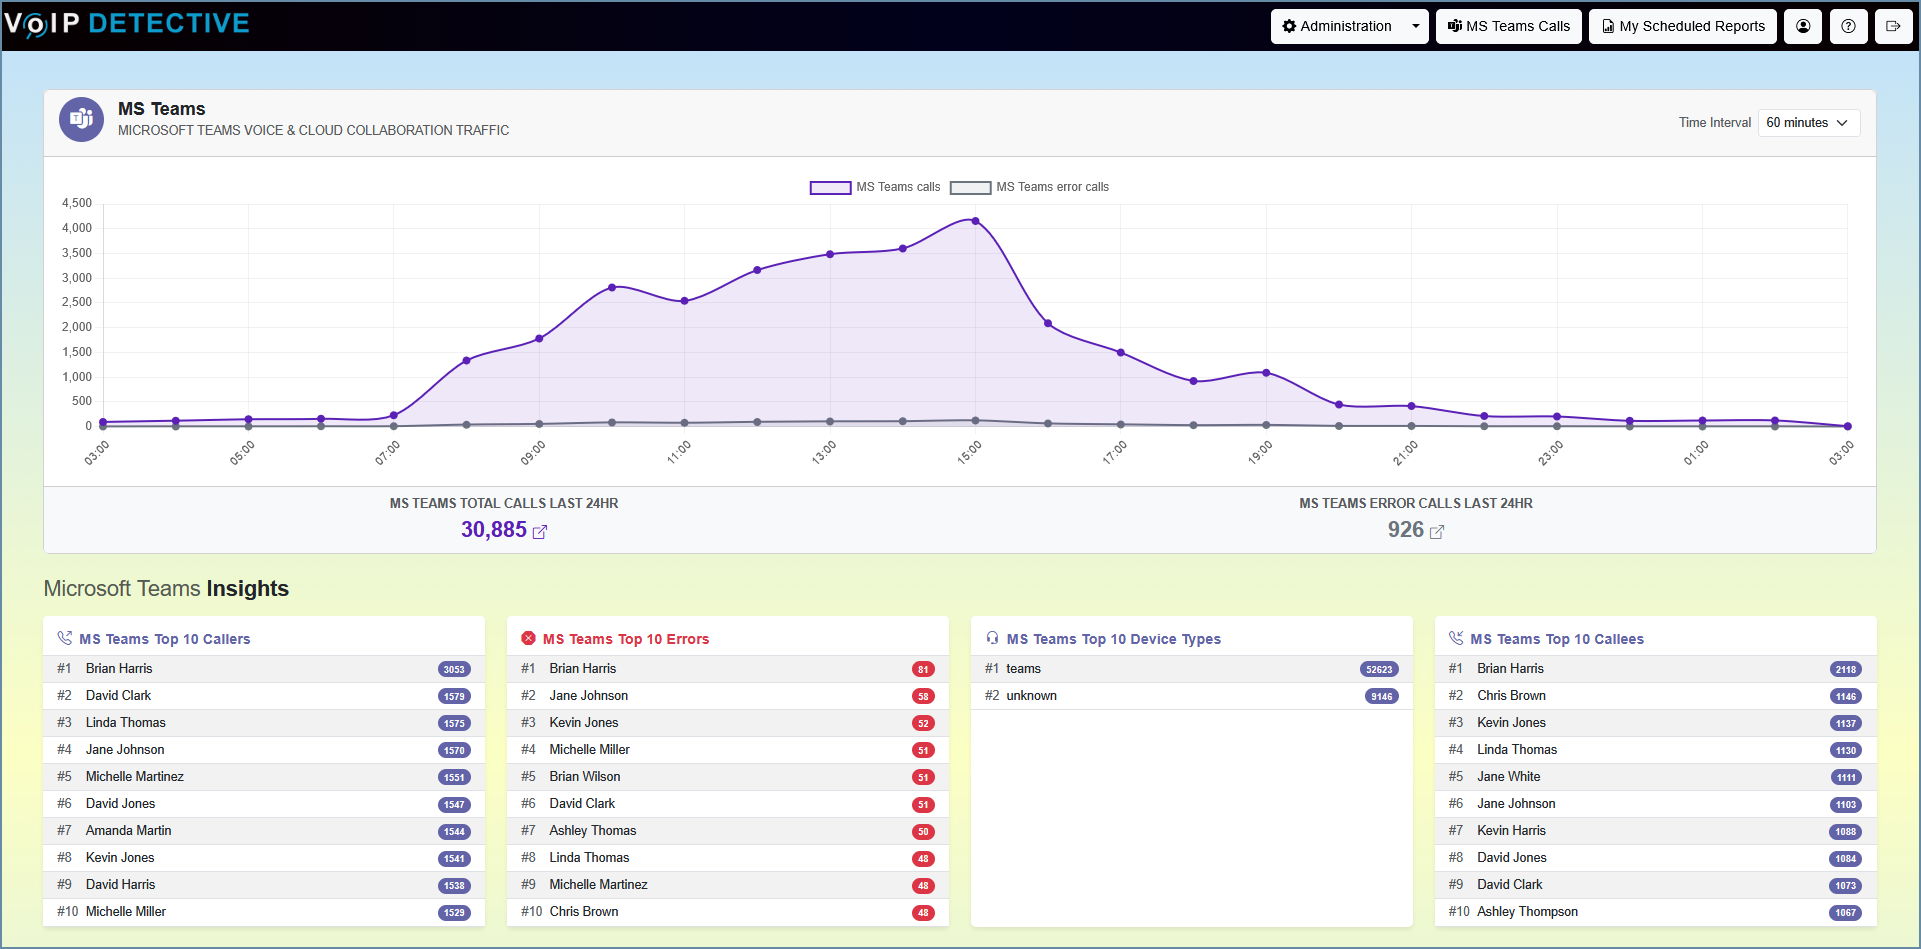
Microsoft Teams Calling Dashboard
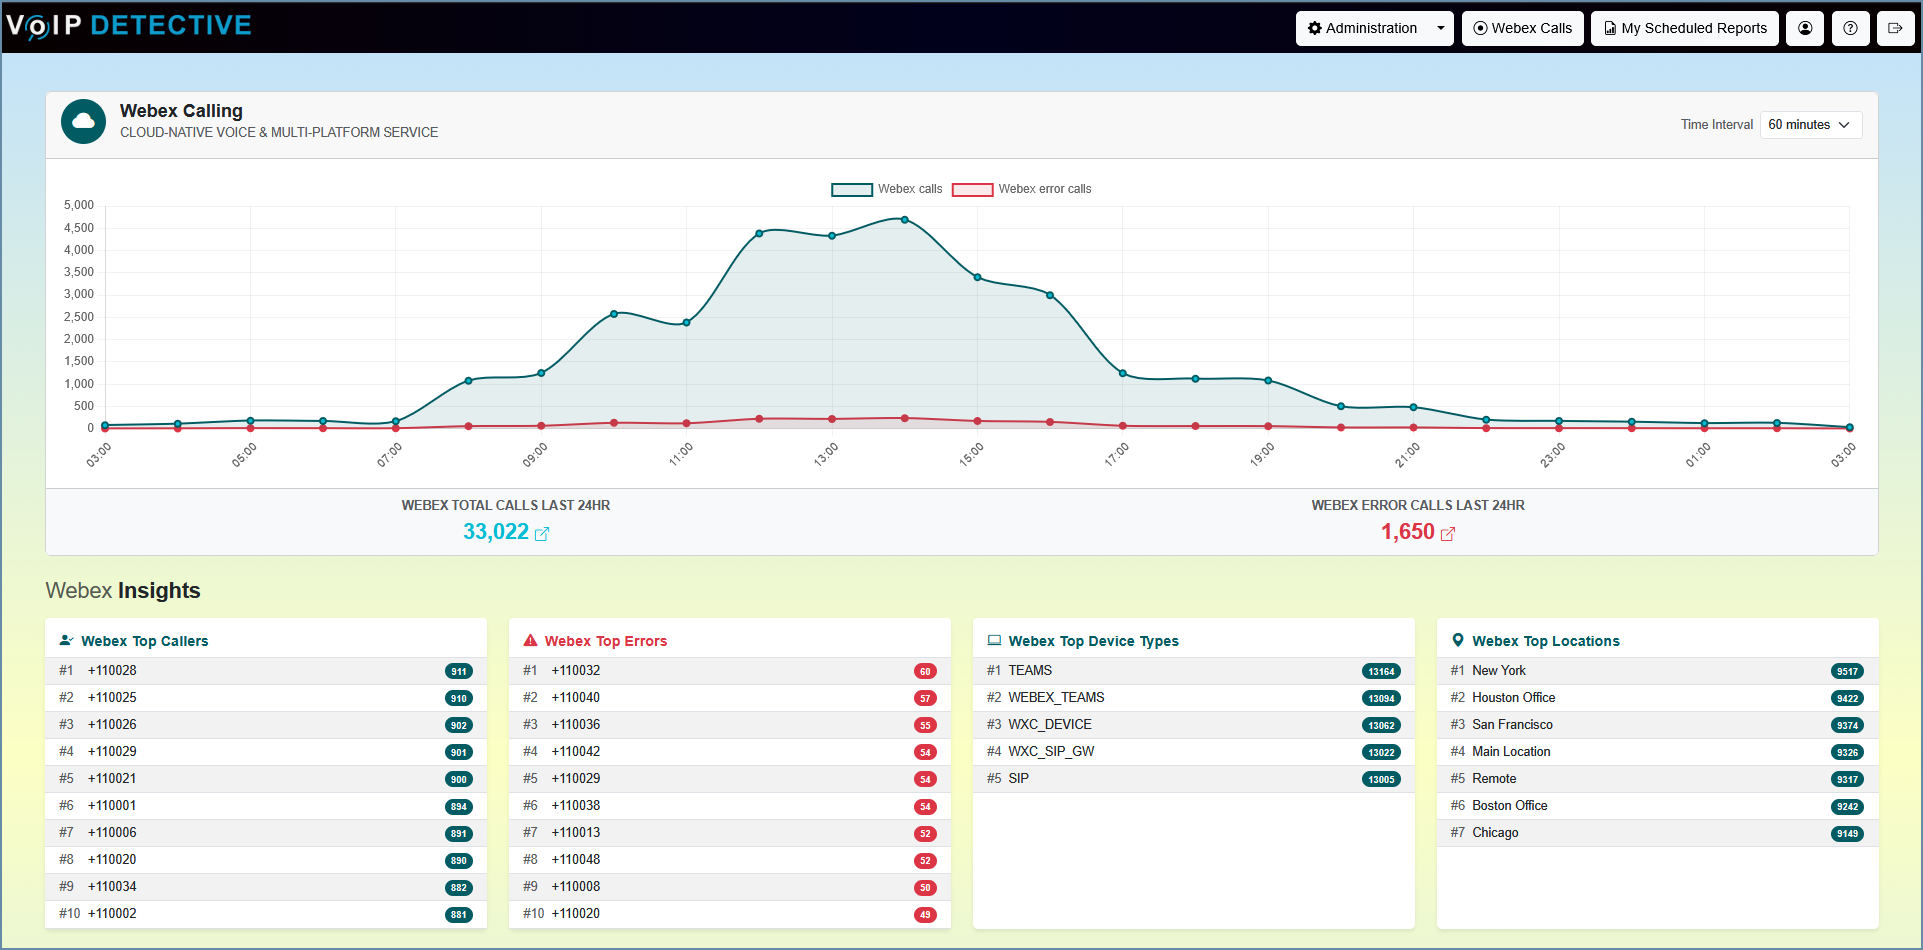
Webex Calling Dashboard
Using Graphs:
By clicking on items in the legend, you can enable or disable information in the chart. For example, if we have this CUCM call chart:

Clicking on the word "CUCM call legs" in the legend will remove that item from the chart. Clicking on the text again will restore it.

Mousing over information. By hovering over a particular "hour of the day", a tooltip will come up that will provide you with information about that particular hour. Excellent for getting detailed numbers.

CUCM and CUBE dashboard details:
Definitions:
- Emergency Calls Last 24hr - the number of calls to emergency services in the last 24 hours. Clicking on this number will display calls that have taken place.
- Total Call Legs Last 24hr - the total number of call legs completed calls in the last 24 hours. 0 second calls are not counted.
- Error Call Legs Last 24hr - call legs that failed for one reason or another. This includes wrong numbers and other non-critical failures.
- Call stats over the last 24 hours (graph) - this graph shows the call legs that have occurred over the last 24 hours. Please note that a leg is different than a call. Each endpoint will have a leg, so in most calls, there will be two legs, however in conference calls, there can be 3 or more legs.
- Failed call legs - this shows specific error codes for your call failures. Useful for tracking down issues.
- Call legs by Gateway - call legs that have traversed each gateway during that time period. Gateways with 0 calls will not be listed.
Important to note - Most of the statistics on this page refer to "Call Legs". A single call can be comprised of multiple legs. For example:
- Call that never connects will likely be only one call leg
- Call that connects to another party would likely have two call legs
- Calls that are conference calls, transfers, forwards, etc would likely have 3 or more legs.
Webex and MS Teams dashboard details:
Definitions:
- Top Callers - The top 10 devices making and receiving calls.
- Top Errors - The top 10 devices that have generated errors.
- Top Device Types - VoIP Detective takes a count of each device type and produces a list of the top 10
- Top Locations - The top 10 locations (as configured in your Webex or MS Teams tenant) that made calls of the last 24 hours.
Was this article helpful?
That’s Great!
Thank you for your feedback
Sorry! We couldn't be helpful
Thank you for your feedback
Feedback sent
We appreciate your effort and will try to fix the article